Australia's 2019/20 bushfire season is one of the worst on record, with quarter of a million people evacuated, 2,000 homes lost and at least 28 people killed since its unusually early start last September. The fires are occurring after years of drought, as the country is hit by a severe heat wave.
Our latest data visualisation shows this season's wildfires spreading across southeastern Australia, from September 2019 to January 2020. The fires active each day are shown in yellow, and the cumulative burned area left behind is shown in red, against a natural-colour, cloud-free satellite image-map and digital terrain model. It is clear that this year's fires have torn through large areas of forest rather than grassland or bush.
The map below shows the fires active on 3 January 2020 and areas burned in Queensland, New South Wales and Victoria since 1 September 2019. Across Australia, more than 107,000 sq km of grassland, bush and forest has burned - an area larger than England.
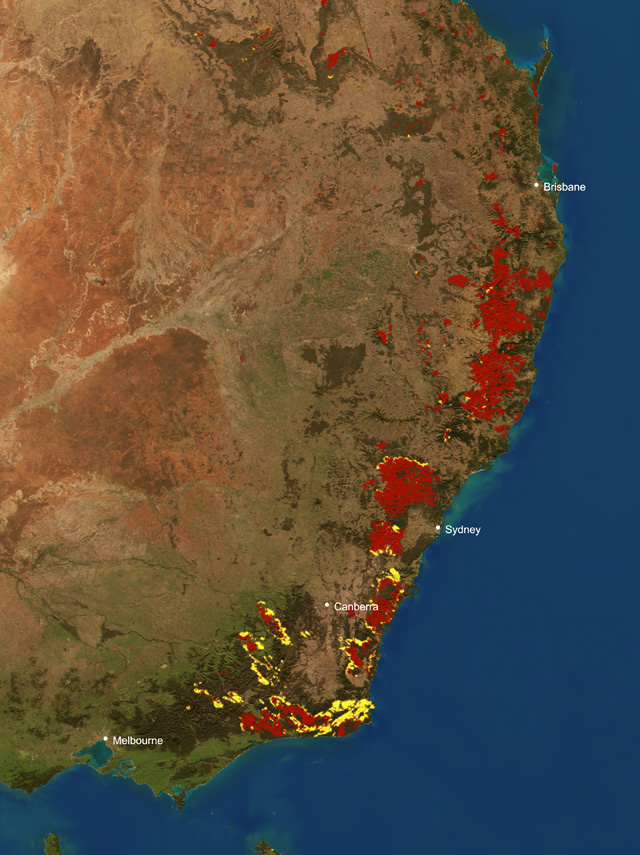
Map and animation produced by Planetary Visions based on NOAA Suomi-VIIRS satellite data from NASA's Fire Information for Resource Management System (FIRMS). (credit: Planetary Visions/NASA/NOAA)
To donate to the Australian Red Cross Disaster Relief and Recovery Fund, click the link below.