Typhoon Haiyan is the strongest storm ever to have hit land. An immensely powerful super typhoon, it was observed and tracked by a fleet of weather satellites belonging to several countries. Japanese and Russian geostationary satellites provided an overview of the western Pacific Ocean, while polar-orbiting satellites from India and South Korea showed a closer view. The most detailed meteorological images came from the American polar-orbiting satellite, Aqua, which we have used here to produce computer graphic views showing the 3D structure of the storm as it approached the Philippines on 7th and 8th November 2013.
Typhoon Haiyan, 7 Nov 2013

Computer graphic simulated view of Typhoon Haiyan over the Philippine Sea based on data from the Moderate Resolution Imaging Spectroradiometer (MODIS) on NASA's Aqua satellite, acquired on 7th November 2013. The simulation combines visible imagery with infrared data, which gives the height of the clouds, to provide a view of the storm as it would appear from orbit at an altitude of 500km.
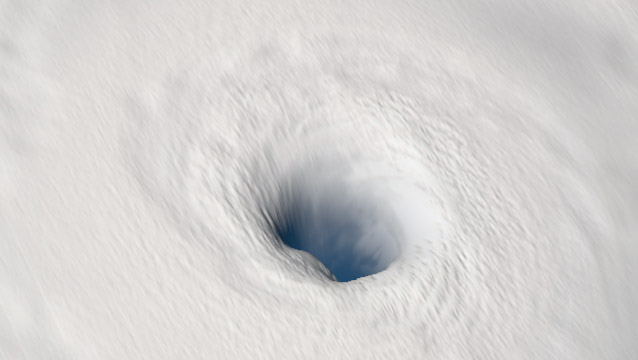
Eye of the Storm

Infrared measurements allow cloud height to be calculated, enabling us to peer into the eye of Haiyan in this view from an altitude of 960km. North is to the right of this image.
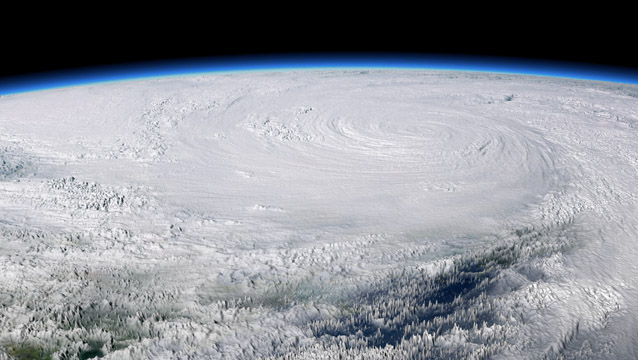
Landfall, 8 Nov 2013

A sea of cloud stretching to the horizon engulfs the Philippines as Typhoon Haiyan makes landfall on 8th November 2013. By this time the storm's eye had filled in.
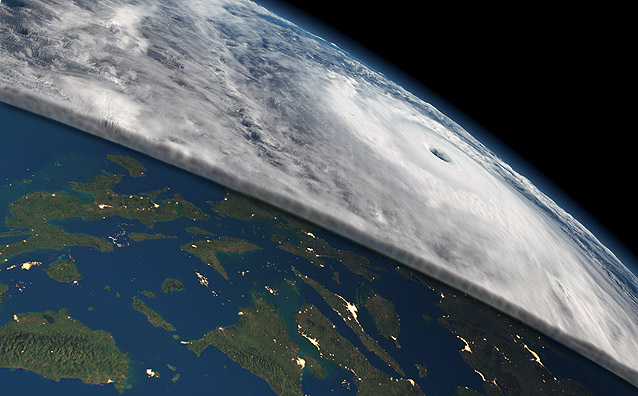
Cross Section

Computer graphic cross-section through Typhoon Haiyan, looking east into the storm from 500km above the South China Sea. The central islands of the Philippines are in the foreground, with Luzon on the left and Mindanao on the right. North is to the left. Towns, fishing grounds and oil fields in the path of the storm are shown by lights observed in night-time satellite imagery.
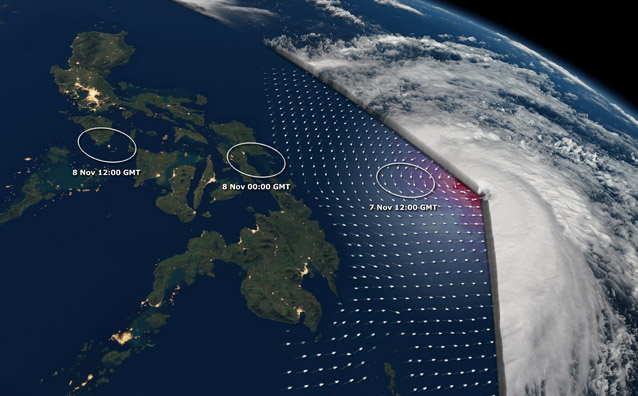
Wind Speed

Wind speeds over 120 miles per hour were measured by the radar scatterometer on the Indian Space Research Organisation's Oceansat-2 satellite on 7th November (shown in red above). Winds later approached 195 mph (310 km/h). The path of the storm across the central islands of the Philippines is shown at twelve-hour intervals.
Computer graphics Copyright © 2013 Planetary Visions, based on Aqua MODIS images from NASA Goddard Space Flight Center, Suomi VIIRS night-time mosaic from NASA/NOAA, and Oceansat-2 wind speed map from NASA Jet Propulsion Laboratory.
To help survivors of Typhoon Haiyan, click the link below.
