Worldwide terrain
Our Worldwide Digital Terrain products have been assembled from the best publicly-available elevation data sources. They cover the World's entire land surface with a grid spacing (pixel size) of 30 arcseconds (1km at the Equator), and 80% of the land surface at 3 arcseconds (100m at the Equator). They can be provided with a choice of masks to differentiate the land from sea, from sea and lakes, or from sea, lakes and rivers.
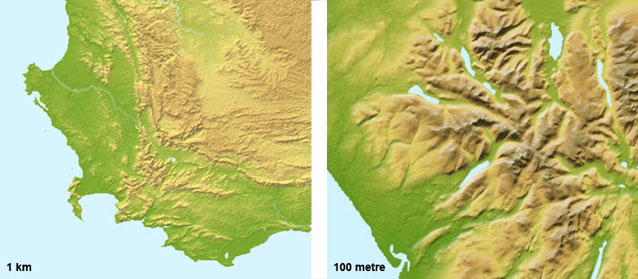
1km digital terrain is suitable for mapping at a print scale of 1:3,000,000 (at 300dpi) or a screen scale of 1:750,000 (at 72dpi), showing major physical features such as mountain ranges, large valleys and plains. 100 metre digital terrain is suitable for mapping at a print scale of 1:300,000 (at 300dpi) or a screen scale of 1:75,000 (at 72dpi) - good enough to show individual mountain peaks and valleys. Our Digital Terrain products have been specially processed in-house to overcome the limitations of the source data from which they were derived (see below).
Coverage: Worldwide (1km), 60° North to 60° South (100 metre)
Grid spacing: 30 arc seconds (1 km at the Equator) or 3 arc seconds (100m at the Equator)
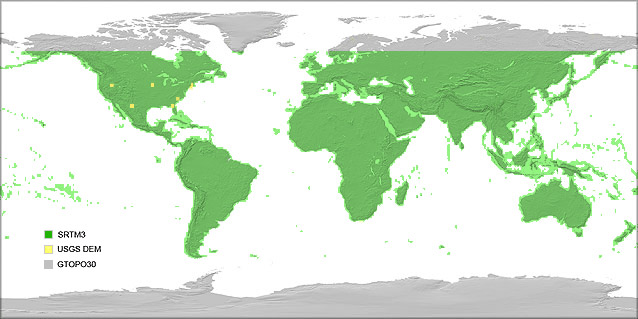
Data source: SRTM3, GTOPO30
Source Data and Improvements
Our Worldwide Digital Terrain product is largely based on SRTM3 data from the US National Geospatial-Intelligence Agency (NGA) and NASA. Derived from interferometric radar measurements from the Space Shuttle, SRTM3 gives very accurate height measurements, but suffers from isolated data gaps in areas of high relief and some very flat areas. We have spent considerable time plugging these data gaps using a combination of techniques outlined below.
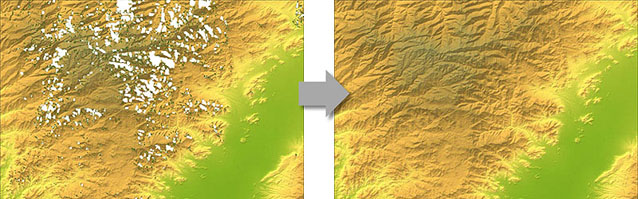
For small gaps, interpolation of the local SRTM data was used; For larger gaps, the SRTM data was extrapolated and then smoothly blended with the less-detailed GTOPO30 terrain model; For large area gaps within the United States, 90 metre terrain data from the US Geological Survey was used. Examples of the raw data are shown above (left), with data gaps in white, alongside our improved data for the same area (right). The map below shows the source of our data in different parts of the world. For Antarctica and areas north of 60°, 1km GTOPO30 data was used.